Many types of data can be represented as trees, and in addition to
dendrograms or
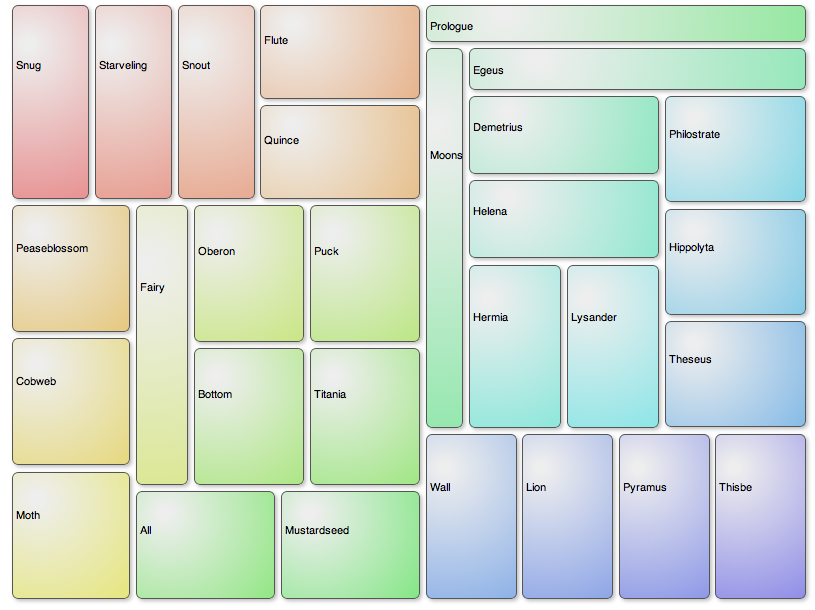
fractal maps can be represented in compact rectangular treemaps. When the data consist of objects separated by known distances, many types of
clustering will put them in tree form. That's what's going on here: we have city data (where distance has its familiar meaning), random data, and text data from Shakespeare where "social distance" is inversely proportional to the number of times that characters have consecutive speeches (and so are probably conversing). The data here are identical to the dendrograms, look at them side-by-side to see how the tree gets "folded" into the treemap.
There are quite a few variations on treemap algorithms. I chose direct recursive splitting because it preserves the tree structure (which the "squarified treemap" algorithm does not, it's more of a knapsack algorithm). Also my datasets usually have about equal leaf-weights and are always binary (two branches or leaves per node), so the original algorithm works well, there aren't too many skinny boxes. As the tree is built I rotate branches to move "weightier" branches toward the visual center of the frame; this keeps the more connected elements to the center and reinforces our expectation that the center should be more connected than the rim. Note how simple CSS changes turn a treemap into a tag cloud, but one where inter-word distance has meaning.
There's a lot of classic computer science in this page's code: data reduction, representation of 2D distance matrices as fast 1D hash tables, hierarchic clustering, recursive routines galore to turn the trees into pixel positions. With a modern browser (Safari, Chrome, Firefox, Opera), it's all fast enough.
All the boxes are positioned DIVs (no HTML5 canvas) so any browser will work. If you don't have Safari, Chrome, or Firefox,
here's what their CSS gives you. I don't support all of IE's weird variants to set opacity. The spectrum-sequence coloring is done by working in HSV color space, far more natural than RGB. Position, color, and mouse-over tree backtracking are all used to highlight the distance relationships in the data.